A novel procedure for accurately measuring the Mode II fracture toughness of steel fiber reinforced self-compacting concrete
Introduction
Self-compacting concrete (SCC), a category of high-performance concrete, is a specialized material first developed by Japanese researchers. It provides enough cohesion to prevent segregation or bleeding. This advanced concrete is designed to fill formwork spaces under its own weight without mechanical vibration, a solution driven by the demand for casting narrow, highly reinforced structures. Using SCC accelerates the construction process and reduces labor costs while avoiding issues like porous concrete and weak bonding that can occur with traditional concrete in congested zones. While SCC retains the brittleness and crack propagation behavior typical of conventional concrete, embedding fibers within the matrix/concrete, named fiber reinforced concrete (FRC), has proven effective in enhancing the tensile and flexural performance, increasing toughness, and superior energy absorption of fiber reinforced selfcompacting concrete (FRSCC) [1-2]. Adding the fibers to concrete involves various variables, including their shape, length, and cross-section. Hooked-end steel fibers significantly contribute to enhancing concrete performance. Although the inclusion of steel fibers enhances the mechanical performance of SCC, it also leads to noticeable challenges in the fresh state of SCC. As a result, these changes can negatively influence the mix's flowability, passing ability, and segregation resistance. Several studies have shown that low fiber volume fraction percentage (Vf%) can still enhance performance, especially when workability is a key concern [1].
On the other hand, fracture has emerged as a key concern in structural analysis and design [3-6]. Despite the extensive research on the mode I (tension mode) fracture toughness of FRC [3,5], investigations into pure mode II (sliding mode) fracture toughness remain relatively limited. However, mode II plays a vital role in structural situations involving jointed interfaces, interfacial cracks, or shear-induced slip in concrete components, where sliding governs crack behavior
with increasing
To overcome this dilemma, Sallam and co-workers [13-19] proposed an innovative method by introducing the use of matrix cracks (MC) to preserve fiber bridging in the case of pure mode I and mixed mode I and II cracks, representing a significant step toward achieving more realistic fracture behavior. Ali et al. [13] studied the effect of increasing the notch depth to beam depth (
The effect of the ratio between span length to depth (
In a recent study published online on September 12, 2025, Cai et al. [8] studied the effect of a/w on the KIIC of FRC using DNC TTC specimens, this means, or in other words, to the best of the authors' knowledge, that no research has been found in the literature to date addressing the
On the other hand, fracture has emerged as a key concern in structural analysis and design [3-6]. Despite the extensive research on the mode I (tension mode) fracture toughness of FRC [3,5], investigations into pure mode II (sliding mode) fracture toughness remain relatively limited. However, mode II plays a vital role in structural situations involving jointed interfaces, interfacial cracks, or shear-induced slip in concrete components, where sliding governs crack behavior
with increasing
To overcome this dilemma, Sallam and co-workers [13-19] proposed an innovative method by introducing the use of matrix cracks (MC) to preserve fiber bridging in the case of pure mode I and mixed mode I and II cracks, representing a significant step toward achieving more realistic fracture behavior. Ali et al. [13] studied the effect of increasing the notch depth to beam depth (
The effect of the ratio between span length to depth (
In a recent study published online on September 12, 2025, Cai et al. [8] studied the effect of a/w on the KIIC of FRC using DNC TTC specimens, this means, or in other words, to the best of the authors' knowledge, that no research has been found in the literature to date addressing the
Experimental work
Materials and mix proportions
SFRSCC was designed for the experimental program. Type I Portland cement with grade 42.5 N was used. Coarse aggregate (dolomite) with NMS 10 mm and specific gravity of 2.7 was used; natural siliceous sand with a specific gravity of 2.55 was used. The physical and mechanical properties of the coarse and fine aggregates are listed in Tab. 1. High water reduced the named Viscocrete-3425 from Sika Company, with
The fresh concrete properties of SCC were measured just after mixing, through the following tests: the slump flow, T50, V-funnel, and L-box tests according to EFNARC [20]. The fresh property results of SCC with
The fresh concrete properties of SCC were measured just after mixing, through the following tests: the slump flow, T50, V-funnel, and L-box tests according to EFNARC [20]. The fresh property results of SCC with
| Coarse aggregate (dolomite) | Fine aggregate | ||
| Property | Measured Value | Property | Measured Value |
| Specific gravity | 2.7 | Specific gravity | 2.50 |
| Unit weight, ( |
1.455 | Unit weight, ( |
1490 |
| Absorption, % | 0.86 % | Fine material ( |
1.1 % |
| Crushing value, % | 23.73 | ||
| Impact value, % | 11.92 | ||
| Los Angeles value, % | 17.4 | ||
Table 1: Coarse and fine aggregates' physical and mechanical properties.
| Cement | Water | Sand | Dolomite | Steel Fiber | Admixture (1.5%) |
| 400 | 160 | 970 | 970 | 79 | 6.0 |
Table 2: SCC mix proportions with
| Property | Slump Flow (mm) | T50 (sec) | V-Funnel time (sec) | L-box (ratio) |
| Measured value | 730 | 3.0 | 7.3 | 0.96 |
| Acceptance criteria (EFRNARC) [20] | 600-800 | 2-5 | 6-12 | 0.8-1 |
Table 3: Fresh Properties of SCC with
The compressive strength of SCC was measured by testing 150 mm side length cubes [21], and indirect tensile strength was measured by testing 300 mm height and 150 mm diameter cylinders [22]. The specimens were demolded 24h after casting and cured for 28 days before testing. The compressive and indirect tensile strengths for SCC without fiber were 31.5 MPa and 3.0 MPa , respectively. Incorporating hooked-end steel fibers into SCC slightly improved its compressive strength by 1.19 and 1.24 for
Experimental program
The shear strength of concrete was measured using the push-off specimens, the most common specimen (L-shape specimen) consisting of two L-shaped blocks connected by a tie through which the shear load is applied. The geometry and dimension details of the L-shape specimen are found elsewhere [23]. The shear strength of SCC with and without fibers was measured through L-shape specimens. Double-notched cube (DNC) specimens were selected due to their practical simplicity and proven capability to promote
First series; (SCC) specimens without fibers, second series; (MC/C configuration) the fibers were only presented along the pre-notch surfaces with a Vf% equals to
ensure statistical reliability. The configuration of the four series was shown and described in Fig. 2 and Tab. 5. To the best of the authors' knowledge, the concept of matrix-cracked specimens has not yet been adopted for measuring the real mode II fracture toughness in FRCs; see e.g. [8].
First series; (SCC) specimens without fibers, second series; (MC/C configuration) the fibers were only presented along the pre-notch surfaces with a Vf% equals to
ensure statistical reliability. The configuration of the four series was shown and described in Fig. 2 and Tab. 5. To the best of the authors' knowledge, the concept of matrix-cracked specimens has not yet been adopted for measuring the real mode II fracture toughness in FRCs; see e.g. [8].

Figure 1: Specimen geometry:
| Mix | Maximum Shear Stress (MPa) | Comparison [(L-shape-DNC)/Lshape]% | ||||
| L-shape | 0.3 | 0.4 | 0.5 | Average | ||
| SCC | 5.18 | 4.4 | 5.04 | 5.08 | 4.84 | 6.6% |
| SCC with |
7.04 | 7.05 | 7.46 | 8.18 | 7.56 | -7.4% |
| SCC with |
9.78 | 8.09 | 8.51 | 11.01 | 9.2 | 5.9% |
Table 4: Comparison between the shear strength measured through L-shape and DNC specimens.

Figure 2: Specimens configuration according to fiber arrangement; (a) SCC, (b) MC/C, (c) TTC, (d) MC.
Matrix crack-preparing and test setup
To simulate realistic Mode II fracture behavior, MC specimens were prepared by inserting two foam panels of 2 mm in thickness in the mold; the foam dimensions matched the intended crack lengths, one-third of the total number of steel fibers representing Vf% of 1 or
fibrous composites. In the case of the TTC specimens, the crack was cut with a saw to obtain a fiber-free surface and ensure that no bridging fibers remained on the pre-crack surfaces.
fibrous composites. In the case of the TTC specimens, the crack was cut with a saw to obtain a fiber-free surface and ensure that no bridging fibers remained on the pre-crack surfaces.
| Series | Series name | Specimen ID | Fiber arrangement | Vf% | a/w |
| SCC-0.3 | |||||
| 1st | SCC | SCC-0.4 | - | - | 0.3, 0.4, and 0.5 |
| SCC-0.5 | |||||
| 2nd | MC/C | MC/C 1%-0.3 | Only at the fabricated MC surface | ||
| MC/C 1%-0.4 | 1.0 % | 0.3, 0.4, and 0.5 | |||
| MC/C 1%-0.5 | |||||
| 3rd | TTC | TTC 1% -0.4 | Distributed throughout the entire specimen (no fiber at the crack) | 1.0 % | 0.3, 0.4, and 0.5 |
| 4th | MC | MC 1%-0.3 | Distributed throughout the entire specimen and the fabricated MC surface | ||
| MC 1%-0.4 | 1.0 % | ||||
| MC 1.5% -0.3 | 0.3, 0.4, and 0.5 | ||||
| MC 1.5% -0.4 | 1.5 % | ||||
| MC 1.5% -0.5 | |||||
Table 5: Configuration of test specimens.
The specimens were tested using a hydraulic compression testing machine with a maximum load capacity of 2000 kN , conforming to the BS 1881-115 [24]. The machine was used to apply compressive loading vertically on the specimens until failure. To ensure proper load transfer and accurate crack propagation under shear, three steel plates were placed symmetrically at each specimen's base and loading points, aligned with the notches. Fig. 4 shows the test setup. The specimens were loaded under loading control with a rate of
a)


Figure 3: MC preparation sequence. a) Fiber distribution in foam panels; b) Foam panel adjustments in the steel mold.

Figure 4: Set up and instrumentation.
Watkins's formula [7] of Mode II fracture toughness (
where
RESULTS AND DISCUSSION
Fracture toughness using DNC specimens
Kiic values for DNC specimens having different values of a/w equal to
As illustrated in Fig. 5, the arrangement of the fibers had a significant effect on the measured

Figure 5: Effect of fiber arrangement on
The effect of the
Once again, at a/w equals to
respectively. Adding fiber along the fabricated MC surface (MC/C
Once again, at a/w equals to
respectively. Adding fiber along the fabricated MC surface (MC/C
| Series name | Vf% | a/w | KIIC | KIIC/ |
||
| SCC | 0% | 0.3 | 167 | 1 | 0.39 | |
| 0.4 | 189 | 1 | 0.39 | |||
| 0.5 | 268 | 1 | 0.52 | |||
| MC/C | 1.0 % | 0.3 | 227 | 1.36 | 0.53 | 1.03 |
| 0.4 | 323 | 1.71 | 0.67 | 1.02 | ||
| 0.5 | 431 | 1.61 | 0.83 | 1.09 | ||
| TTC | 1.0 % | 0.3 | 221 | 1.32 | 0.51 | |
| 0.4 | 316 | 1.67 | 0.66 | |||
| 0.5 | 396 | 1.48 | 0.77 | |||
| 1.0 % | ||||||
| 0.3 | 432 | 2.59 | 1 | 1.95 | ||
| 0.4 | 481 | 2.54 | 1 | 1.52 | ||
| MC | 0.5 | 517 | 1.93 | 1 | 1.31 | |
| 0.3 | 450 | 1.04 | ||||
| 1.5 % | 0.4 | 505 | 1.05 | |||
| 0.5 | 545 | 1.05 | ||||
Table 6:

Figure 6: The effect of the fiber arrangement (
On the other hand, the same observation in the case of a/w equals
Fracture surface shape
The fracture surfaces of the DNC specimens revealed various crack behaviors depending on fiber distribution. In this section, the fracture surface topography will be shown and discussed. The mode of failure of SCC DNC specimens without fiber for different values of
shear plane without deviation, confirming pure mode II fracture, and causing a sudden drop after reaching the maximum load due to the absence of the fibers either behind or ahead of the crack tip. For all specimens with a/w ratios equal to
shear plane without deviation, confirming pure mode II fracture, and causing a sudden drop after reaching the maximum load due to the absence of the fibers either behind or ahead of the crack tip. For all specimens with a/w ratios equal to

Figure 7: Fracture surfaces of SCC; (a)
Fig. 8 illustrates the fracture surfaces of MC/C DNC specimens with fibers localized exclusively along the fabricated MC surface. A high interfacial bond between the mortar and dolomite resulted in transgranular fracture, where the crack propagates directly through the mortar and dolomite. Subsequently, once reaching peak stress, fiber pullout occurred at the specimen's surface. Although fibers are randomly oriented due to different factors such as casting method, dimensions of mold, compaction technique, and concrete mix workability, their closing forces can be analyzed along three perpendicular directions. The most significant direction for studying crack propagation is perpendicular to the crack surface, where fibers provide a bridging effect. Experimental work by Sallam et al [13-19] found the ideal orientation factor to range from 0.3 to 0.48 , which supports the widely recommended value of
As seen in Fig. 8, the primary mechanism observed is fiber pullout, which occurs as the specimen reaches its maximum stress. The effectiveness of this pullout is pronounced by fiber bridging, where fibers spanning the crack exert closing forces to resist its opening. The efficiency of this bridging is highly dependent on fiber orientation.MC/C configuration allowed direct assessment of how crack-focused fibers influence shear resistance without contributions from fibers outside the crack region.
Fig. 9 illustrates the fracture surfaces of TTC DNC specimens, where the fibers were distributed throughout the entire specimen only. As seen in Fig. 9, the fibers were well-distributed and failed by pullout; the uniform fiber distribution provided consistent bridging and energy dissipation along the crack path, as illustrated by extended fiber pullout. This arrangement did not contribute to effective bridging across the crack plane and offered minimal improvement in shear resistance compared to MC or MC/C configurations.
As seen in Fig. 8, the primary mechanism observed is fiber pullout, which occurs as the specimen reaches its maximum stress. The effectiveness of this pullout is pronounced by fiber bridging, where fibers spanning the crack exert closing forces to resist its opening. The efficiency of this bridging is highly dependent on fiber orientation.MC/C configuration allowed direct assessment of how crack-focused fibers influence shear resistance without contributions from fibers outside the crack region.
Fig. 9 illustrates the fracture surfaces of TTC DNC specimens, where the fibers were distributed throughout the entire specimen only. As seen in Fig. 9, the fibers were well-distributed and failed by pullout; the uniform fiber distribution provided consistent bridging and energy dissipation along the crack path, as illustrated by extended fiber pullout. This arrangement did not contribute to effective bridging across the crack plane and offered minimal improvement in shear resistance compared to MC or MC/C configurations.
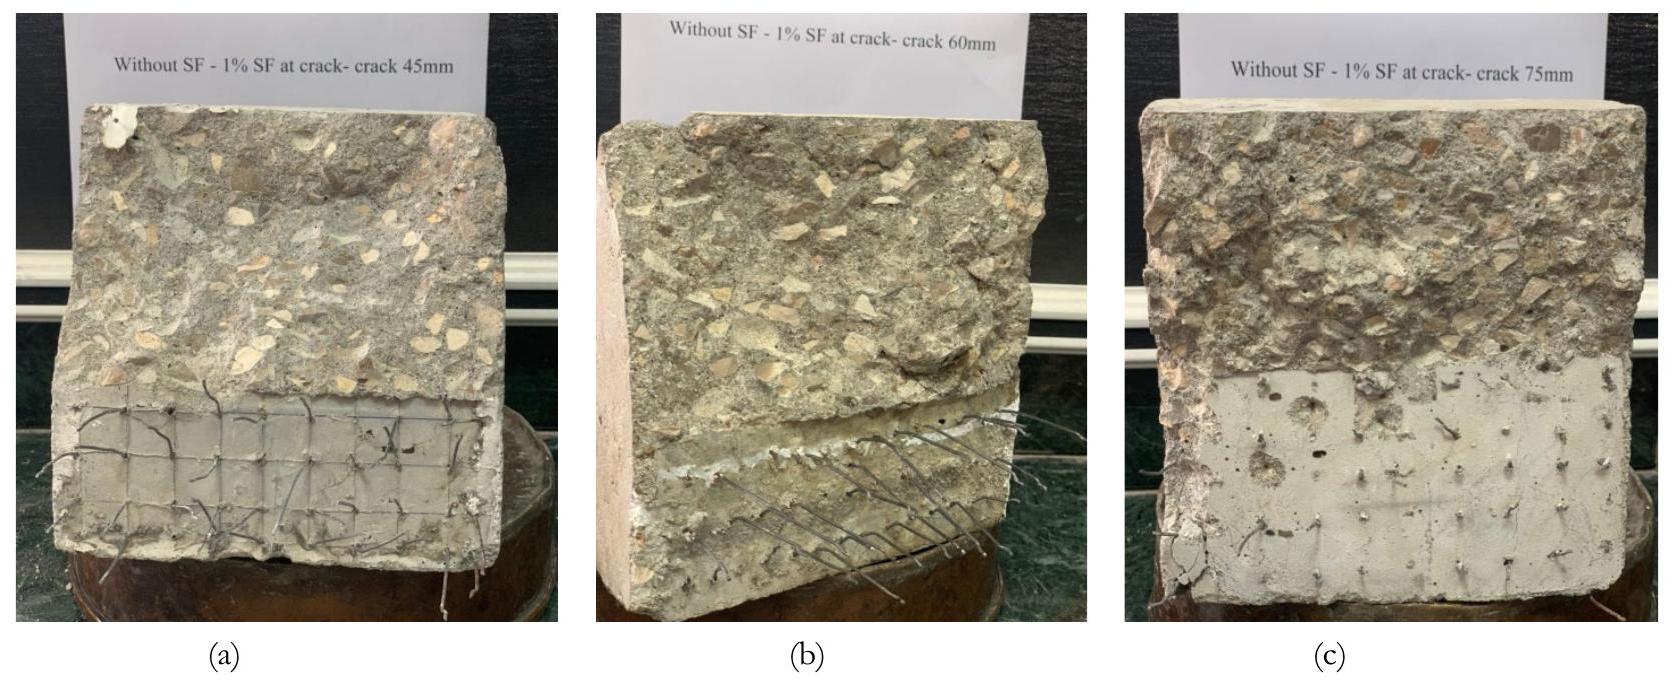
Figure 8 Fracture surfaces of

Figure 9: Fracture surfaces of TTC; (a)
Fig. 10 illustrates the fracture surfaces of MC DNC specimens with fibers uniformly distributed throughout the entire specimen and a fabricated MC surface with a Vf% equal to 1 and
Once again, the limited increase in
Once again, the limited increase in

Figure 10: Fracture surfaces of MC for
Conclusions
M atrix cracked DNC specimens were first realized in the present work to measure the actual Mode II fracture toughness of steel fiber reinforced self-compacted concrete. The results of the present experimental work support the following conclusions:
1- TTC DNC specimens are not suitable candidates for measuring accurate values of the
2- MC DNC specimens are suitable candidates for measuring accurate values of the
3- The measured
4- Comparing
5- Increasing the fiber volume fraction from
6- This study showed that the MC approach works well for assessing pure Mode II fracture toughness; however, several limitations need to be noted. The study was performed using one specimen size, 150 mm , under load control. Future research should examine the size effect on the independence of
1- TTC DNC specimens are not suitable candidates for measuring accurate values of the
2- MC DNC specimens are suitable candidates for measuring accurate values of the
3- The measured
4- Comparing
5- Increasing the fiber volume fraction from
6- This study showed that the MC approach works well for assessing pure Mode II fracture toughness; however, several limitations need to be noted. The study was performed using one specimen size, 150 mm , under load control. Future research should examine the size effect on the independence of
References
[1] Ghomian, M., Dehestani, M., Garshasbi, S. and Azimi, N. (2025). Optimizing fracture resistance in steel fiberreinforced self-consolidating concrete: Insights from mode II and mode I fracture energy analysis. Structures, 75, 108707.
[2] El-Nopy, A. M., Noaman, M. T. and Seleem, M. H. (2022). Utilization of Filler Materials in Self-Compacting Concrete as a Partial Cement Replacement. Tehničkivjesnik, 29(3), pp. 867-874.
[3] Ahmad, S. S. E., Gamiaa, G. M. A. and El-Kholy, A. E. M. I. (2024). The effect of beam width and crack-depth ratio on mode I fracture toughness of RCB: an experimental and numerical study. Frattura Ed Integrita Strutturale, 18(67), pp. 24-42. DOI: https://doi.org/10.3221/IGF-ESIS.67.03
[4] Mousa, S., Mutnbak, M., Saba, A. A. M., Abd-Elhady, A. A. and Sallam, H. E. D. M. (2023). Numerical study and experimental validation of the size effect of smooth and mode I cracked semi-circular bend specimens. Scientific Reports, 13(1), 7570.
[5] Mutnbak, M., Abbadi, A., Mousa, S., Abd-Elhady, A. A., Sallam, H. E. D. M. and Reda, R. M. (2025). Effects of specimen geometry and size on mode I and mixed mode fracture behavior of high strength fiber reinforced concrete. Scientific Reports, 15(1), 15286.
[6] Perrella, M., Armentani, E., Lamanna, G. and Berardi, V. P. (2025). Effect of fracture energy estimation on the predictions of mode II behavior of bonded joints using cohesive zone models. Frattura Ed Integrita Strutturale, 19(72), pp. 236-246. DOI: https://doi.org/10.3221/IGF-ESIS.72.17
[7] Watkins, J. (1983). Fracture toughness test for soil-cement samples in mode II. International Journal of Fracture, 23, pp. R135-R138.
[8] Cai, B., Chen, H., Xu, Y., Fan, C. and Tang, Y. (2025). Effect of notch-to-depth ratio on shear fracture properties of plain and fiber-reinforced manufactured sand concrete using double notched cube test. Journal of Building Engineering, 113,114062. DOI: https://doi.org/10.1016/j.jobe.2025.114062
[9] Prokopski, G. (1991). Influence of water-cement ratio on micro-cracking of ordinary concrete. Journal of Materials Science, 26(23), pp. 6352-6356.
[10] Reinhardt, H. W., Ošbolt, J., Shilang, X. and Dinku, A. (1997). Shear of structural concrete members and pure mode II testing. Advanced cement-based materials, 5(3-4), 75-85.
[11] Cao, R. H., Yu, H., Qiu, X., Lin, H. and Cao, M. (2024). Influence of loading rate on the mode II fracture characteristics of SCC samples: Experiments and numerical simulations. Theoretical and Applied Fracture Mechanics, 134, 104729.
[12] Daies, J., Morgan, T.G. and Yim, A.W. (1985). The finite element analysis of a punch-through shear specimen in mode II. International Journal of Fracture, 28, pp. R3-R10.
[13] Ali, A. Y. F., El-Emam, H. M., Seleem, M. H., Sallam, H. E. M. and Moawad, M. (2022). Effect of crack and fiber length on mode I fracture toughness of matrix-cracked FRC beams. Construction and Building Materials, 341, 127924.
[14] Elakhras, A. A., Seleem, M. H. and Sallam, H. E. M. (2021). Intrinsic fracture toughness of fiber reinforced and functionally graded concretes: An innovative approach. Engineering Fracture Mechanics, 258, 108098.
[15] Sallam, H. E. D. M., Elakhras, A. and Seleem, M. (2022). Fracture toughness of matrix cracked FRC and FGC beams using equivalent TPFM. Frattura Ed Integrita Strutturale, 16(60), pp. 73-88.
[16] Elakhras, A. A., Seleem, M. H. and Sallam, H. E. M. (2022). Real fracture toughness of FRC and FGC: size and boundary effects," Archives of Civil and Mechanical Engineering, 22(2). DOI: https://doi.org/10.1007/s43452-022-00424-6.
[17] Abdallah, M. A., Elakhras, A. A., Reda, R. M., Sallam, H. E. D. M. and Moawad, M. (2023). Applicability of CMOD to obtain the actual fracture toughness of rightly-cracked fibrous concrete beams. Buildings, 13(8), 2010.
[18] El-Sagheer, I., Abd-Elhady, A. A., Sallam, H. E. D. M. and Naga, S. A. (2021). An assessment of ASTM E1922 for measuring the translaminar fracture toughness of laminated polymer matrix composite materials. Polymers, 13(18), 3129.
[19] Hussien, M. A., Moawad, M., Seleem, M. H., Sallam, H. E. M. and El-Emam, H. M. (2022). Mixed-mode fracture toughness of high strength FRC: a realistic experimental approach. Archives of Civil and Mechanical Engineering, 22(4), 168.
[20] EFNARC, F. (2002). Specification and guidelines for self-compacting concrete. European Federation of Specialist Construction Chemicals and Concrete Systems.
[21] BS EN 12390-12393; Testing Hardened Concrete-Compressive Strength of Test Specimens, Part 3. British Standards: London, UK, (2009).
[22] BS EN 12390-12396; Testing Hardened Concrete. Tensile Splitting Strength of Test Specimens, Part 6. British Standards: London, UK, (2009).
[23] Barragan, B., Gettu, R., Agullo, L. and Zerbino, R. (2006). Shear failure of steel fiber-reinforced concrete based on push-off tests. ACI materials journal, 103(4), 251.
[24] BS 1881; Specification for compression testing machines for concrete, Part 115. British Standards: London, UK, (1986).
[25] Abou El-Mal, H. S. S., Sherbini, A. S. and Sallam, H. E. M. (2015). Mode II fracture toughness of hybrid FRCs. International Journal of Concrete Structures and Materials, 9(4), 4pp. 75-486.
[2] El-Nopy, A. M., Noaman, M. T. and Seleem, M. H. (2022). Utilization of Filler Materials in Self-Compacting Concrete as a Partial Cement Replacement. Tehničkivjesnik, 29(3), pp. 867-874.
[3] Ahmad, S. S. E., Gamiaa, G. M. A. and El-Kholy, A. E. M. I. (2024). The effect of beam width and crack-depth ratio on mode I fracture toughness of RCB: an experimental and numerical study. Frattura Ed Integrita Strutturale, 18(67), pp. 24-42. DOI: https://doi.org/10.3221/IGF-ESIS.67.03
[4] Mousa, S., Mutnbak, M., Saba, A. A. M., Abd-Elhady, A. A. and Sallam, H. E. D. M. (2023). Numerical study and experimental validation of the size effect of smooth and mode I cracked semi-circular bend specimens. Scientific Reports, 13(1), 7570.
[5] Mutnbak, M., Abbadi, A., Mousa, S., Abd-Elhady, A. A., Sallam, H. E. D. M. and Reda, R. M. (2025). Effects of specimen geometry and size on mode I and mixed mode fracture behavior of high strength fiber reinforced concrete. Scientific Reports, 15(1), 15286.
[6] Perrella, M., Armentani, E., Lamanna, G. and Berardi, V. P. (2025). Effect of fracture energy estimation on the predictions of mode II behavior of bonded joints using cohesive zone models. Frattura Ed Integrita Strutturale, 19(72), pp. 236-246. DOI: https://doi.org/10.3221/IGF-ESIS.72.17
[7] Watkins, J. (1983). Fracture toughness test for soil-cement samples in mode II. International Journal of Fracture, 23, pp. R135-R138.
[8] Cai, B., Chen, H., Xu, Y., Fan, C. and Tang, Y. (2025). Effect of notch-to-depth ratio on shear fracture properties of plain and fiber-reinforced manufactured sand concrete using double notched cube test. Journal of Building Engineering, 113,114062. DOI: https://doi.org/10.1016/j.jobe.2025.114062
[9] Prokopski, G. (1991). Influence of water-cement ratio on micro-cracking of ordinary concrete. Journal of Materials Science, 26(23), pp. 6352-6356.
[10] Reinhardt, H. W., Ošbolt, J., Shilang, X. and Dinku, A. (1997). Shear of structural concrete members and pure mode II testing. Advanced cement-based materials, 5(3-4), 75-85.
[11] Cao, R. H., Yu, H., Qiu, X., Lin, H. and Cao, M. (2024). Influence of loading rate on the mode II fracture characteristics of SCC samples: Experiments and numerical simulations. Theoretical and Applied Fracture Mechanics, 134, 104729.
[12] Daies, J., Morgan, T.G. and Yim, A.W. (1985). The finite element analysis of a punch-through shear specimen in mode II. International Journal of Fracture, 28, pp. R3-R10.
[13] Ali, A. Y. F., El-Emam, H. M., Seleem, M. H., Sallam, H. E. M. and Moawad, M. (2022). Effect of crack and fiber length on mode I fracture toughness of matrix-cracked FRC beams. Construction and Building Materials, 341, 127924.
[14] Elakhras, A. A., Seleem, M. H. and Sallam, H. E. M. (2021). Intrinsic fracture toughness of fiber reinforced and functionally graded concretes: An innovative approach. Engineering Fracture Mechanics, 258, 108098.
[15] Sallam, H. E. D. M., Elakhras, A. and Seleem, M. (2022). Fracture toughness of matrix cracked FRC and FGC beams using equivalent TPFM. Frattura Ed Integrita Strutturale, 16(60), pp. 73-88.
[16] Elakhras, A. A., Seleem, M. H. and Sallam, H. E. M. (2022). Real fracture toughness of FRC and FGC: size and boundary effects," Archives of Civil and Mechanical Engineering, 22(2). DOI: https://doi.org/10.1007/s43452-022-00424-6.
[17] Abdallah, M. A., Elakhras, A. A., Reda, R. M., Sallam, H. E. D. M. and Moawad, M. (2023). Applicability of CMOD to obtain the actual fracture toughness of rightly-cracked fibrous concrete beams. Buildings, 13(8), 2010.
[18] El-Sagheer, I., Abd-Elhady, A. A., Sallam, H. E. D. M. and Naga, S. A. (2021). An assessment of ASTM E1922 for measuring the translaminar fracture toughness of laminated polymer matrix composite materials. Polymers, 13(18), 3129.
[19] Hussien, M. A., Moawad, M., Seleem, M. H., Sallam, H. E. M. and El-Emam, H. M. (2022). Mixed-mode fracture toughness of high strength FRC: a realistic experimental approach. Archives of Civil and Mechanical Engineering, 22(4), 168.
[20] EFNARC, F. (2002). Specification and guidelines for self-compacting concrete. European Federation of Specialist Construction Chemicals and Concrete Systems.
[21] BS EN 12390-12393; Testing Hardened Concrete-Compressive Strength of Test Specimens, Part 3. British Standards: London, UK, (2009).
[22] BS EN 12390-12396; Testing Hardened Concrete. Tensile Splitting Strength of Test Specimens, Part 6. British Standards: London, UK, (2009).
[23] Barragan, B., Gettu, R., Agullo, L. and Zerbino, R. (2006). Shear failure of steel fiber-reinforced concrete based on push-off tests. ACI materials journal, 103(4), 251.
[24] BS 1881; Specification for compression testing machines for concrete, Part 115. British Standards: London, UK, (1986).
[25] Abou El-Mal, H. S. S., Sherbini, A. S. and Sallam, H. E. M. (2015). Mode II fracture toughness of hybrid FRCs. International Journal of Concrete Structures and Materials, 9(4), 4pp. 75-486.